Gene sharing networks with Vcontact2
Overview
Teaching: 0 min
Exercises: 90 minQuestions
Can we assign a genus-level taxonomic annotations with vContact2?
Do contigs from the same bin cluster together?
How do the vContact2 results compare to other methods we used?
Objectives
Learn to use Vcontact2 and Cytoscape
Assign genus-level taxonomy to assembled viral sequences
Identify potentially wrongly binned contigs
0. Preparations
If you didn’t successfully finish running vcontact2 please download the vContact2 data from here:
# Vcontact2 output
$ wget https://raw.githubusercontent.com/MGXlab/Viromics-Workshop-MGX/gh-pages/data/day_4/c1.ntw
$ wget https://raw.githubusercontent.com/MGXlab/Viromics-Workshop-MGX/gh-pages/data/day_4/genome_by_genome_overview.csv
Task: Check vContact2 output files
Check the vContact2 manual to see what output files are generated by vContact2.
Which files do you need?
What information is contained in these files?
Which sequences are included in the output?
Step 1: Install Cytoscape
To visualise our gene sharing networks we are going to install Cytoscape. Go to https://cytoscape.org/download.html and download Cytoscape. Next, install it:
cd /path/to/downloaded/cytoscape_file
chmod +x Cytoscape_3_9_1_unix.sh
./Cytoscape_3_9_1_unix.sh
And follow the instructions on the screen to install Cytoscape. If everything works out you should end up with a Cytoscape shortcut on your desktop.
Step 2: Load network in Cytoscape
Open Cytoscape with the desktop shortcut. Cytoscape has a graphical interface that might be a bit overwhelming at first.
- Follow steps 7-10 from this manual to load the network file into Cytoscape.
- after you’ve removed the duplicate edges and self loops (see manual linked above), load the
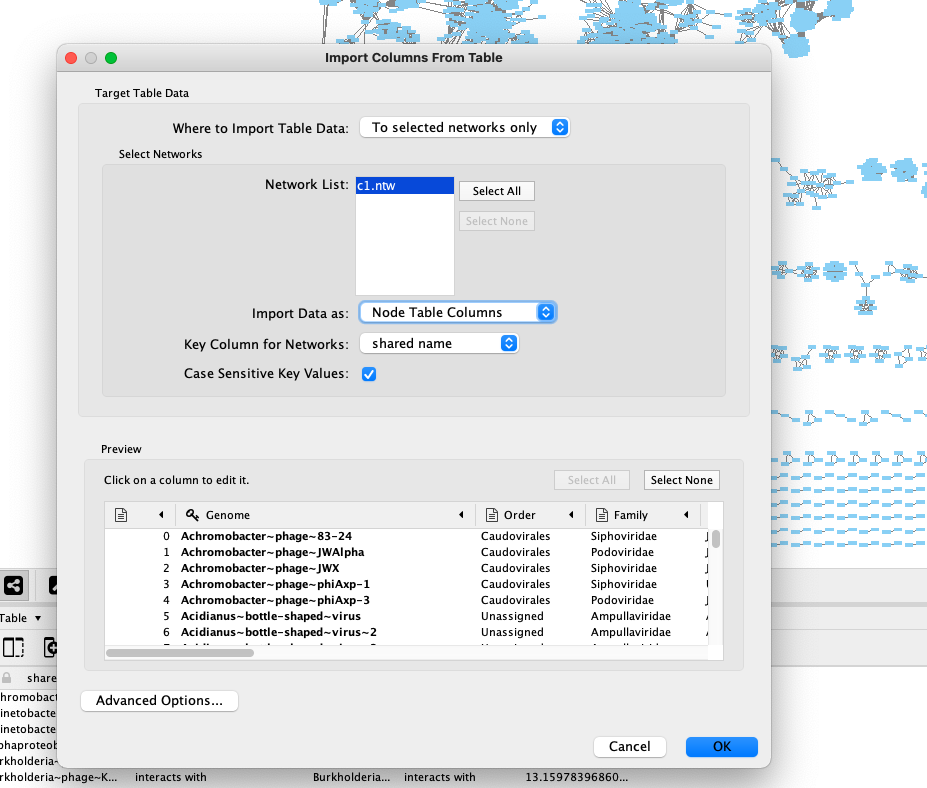
gene_to_genome_overview.csvfile by file > import > table from file and selecting it. In the window that pops up please select the following (see image):- add to a selected network
- import data as Node table columns
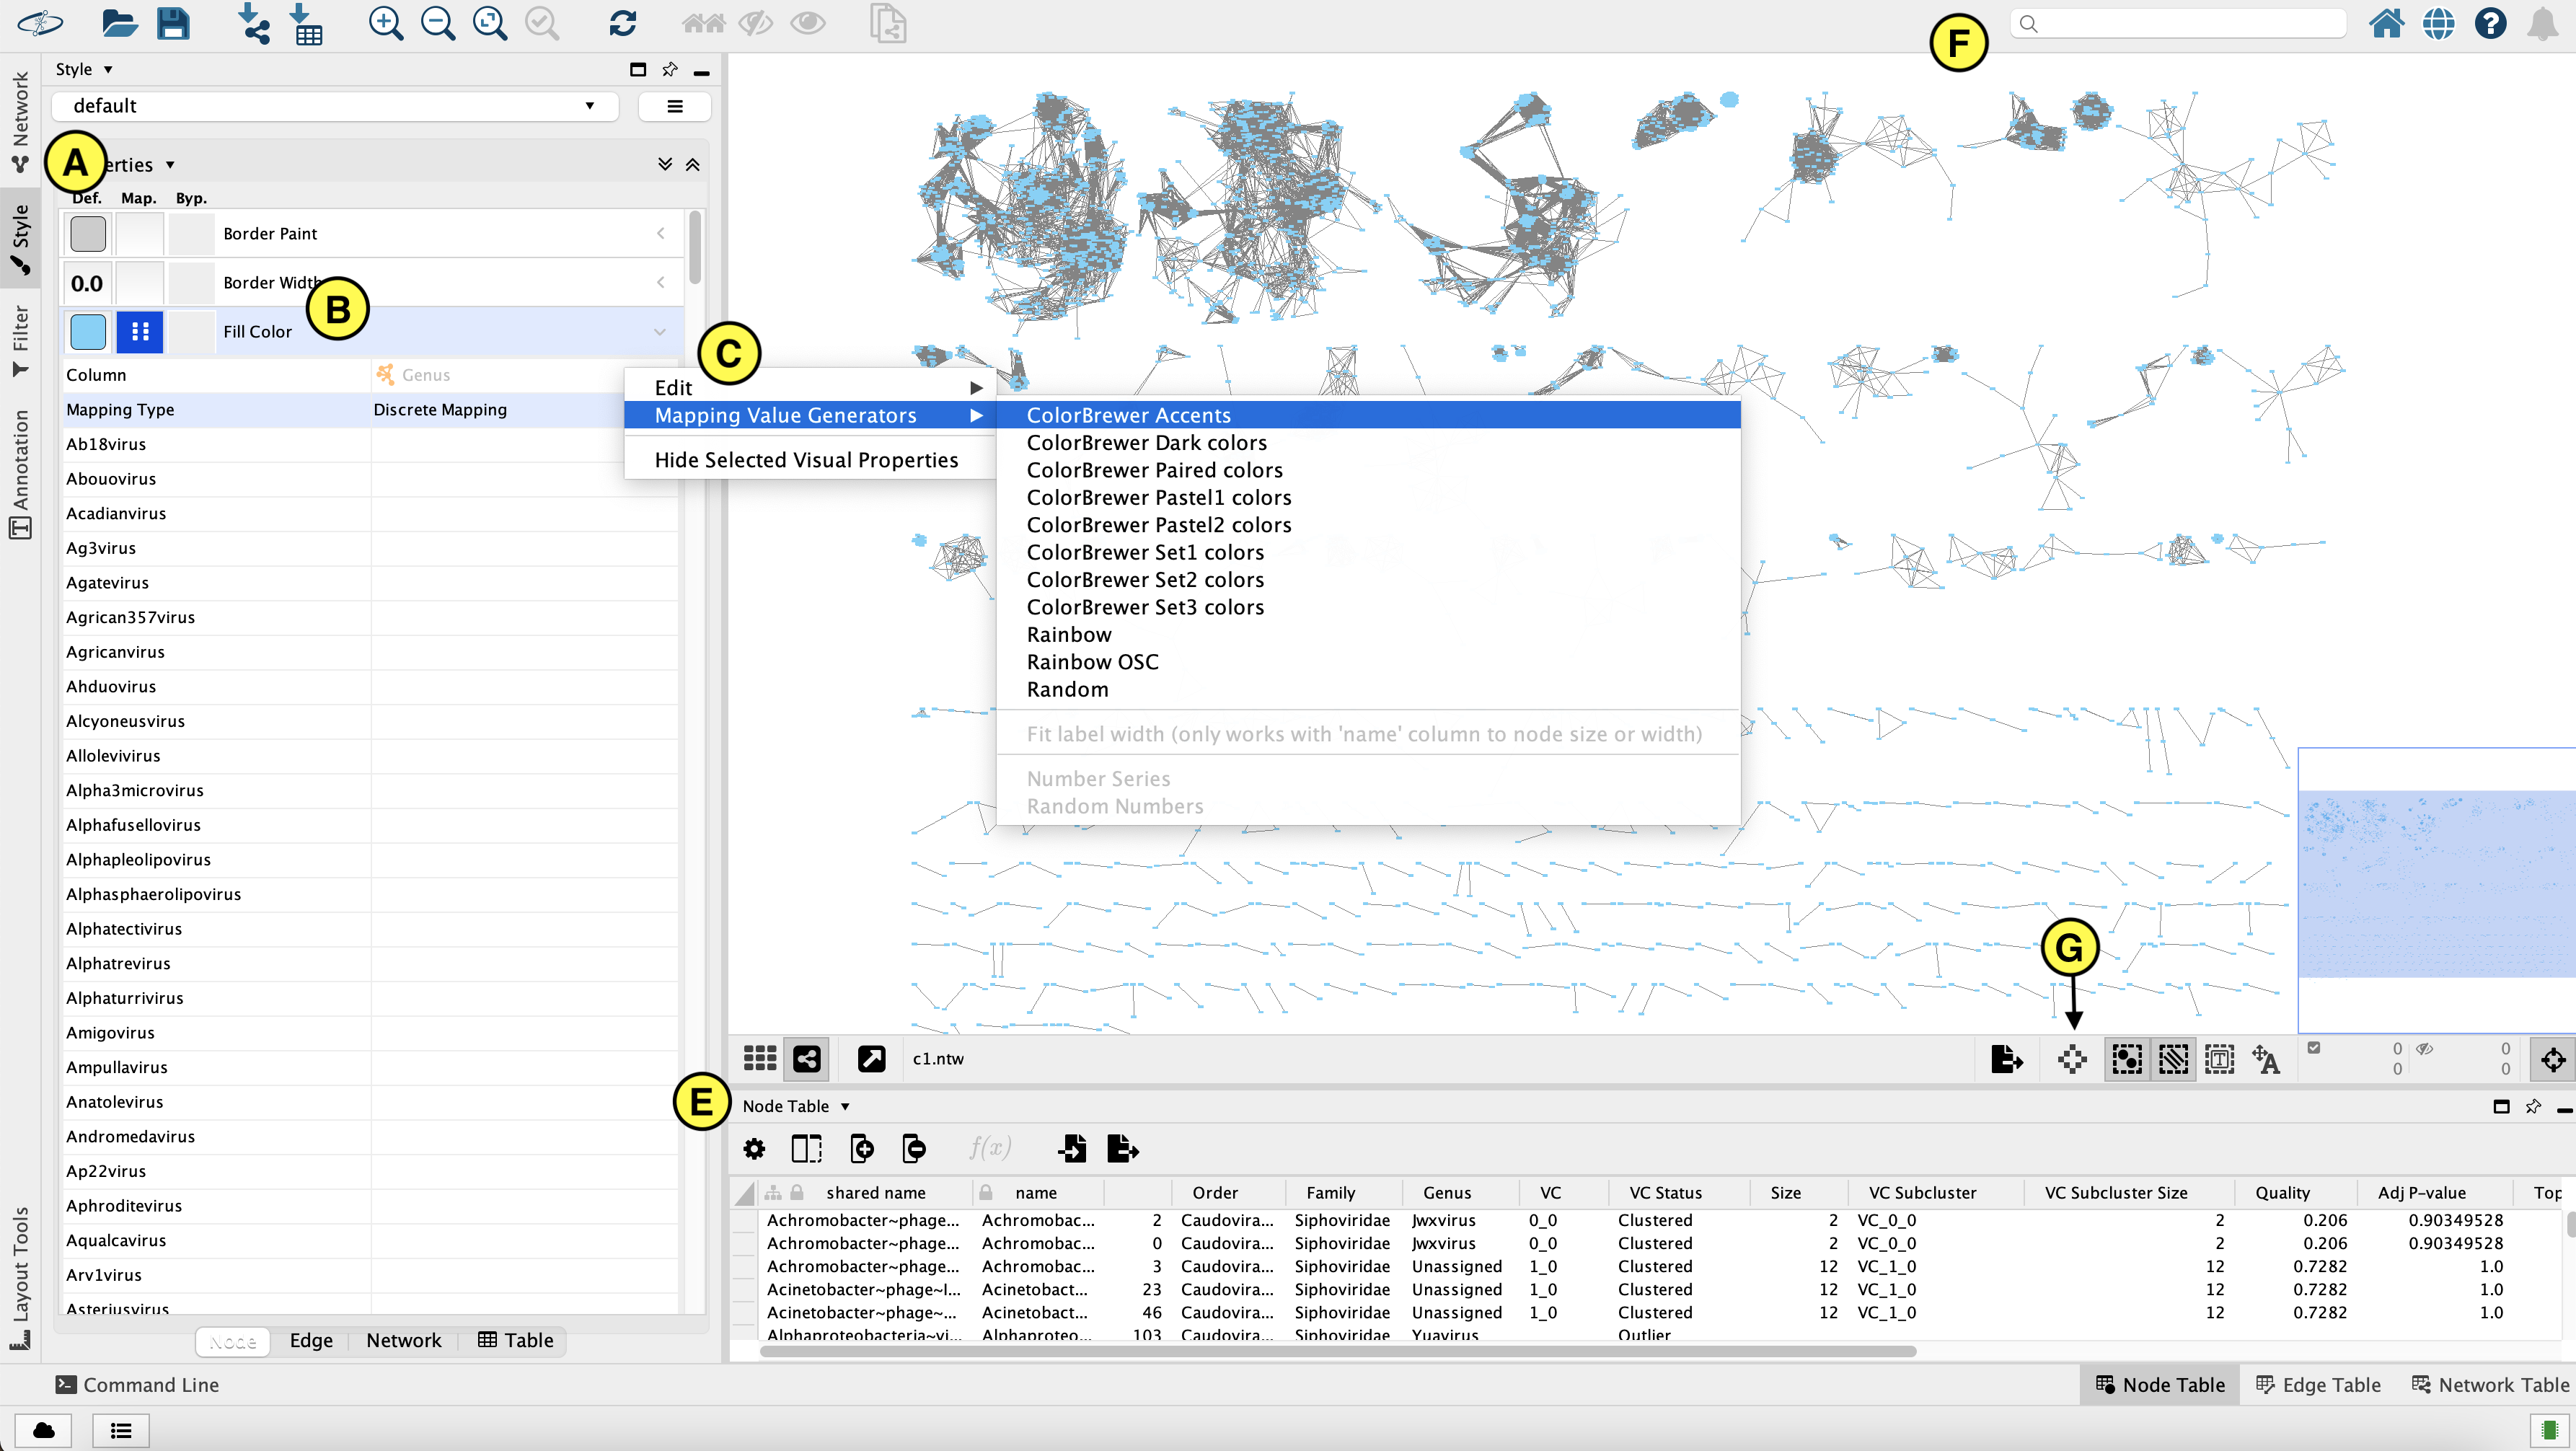
- click genome in Preview and select the key icon If this all worked correcly, you should now have information about the nodes in the “node table” (E in the second figure below)
Step 3: Change the network layout:
‘Layout > Edge-weighted Spring Embedded layout’, and select the column with the numeric data (probably column 3). This places genomes that share more protein clusters closer together.
Step 4: Explore the data and explain what you see
Take a moment to look at what you see. Why are the networks and nodes organised like this? Inspect a few nodes. Play around with a few colour schemes. Look at the clustering status of nodes that are close together in the network.
(read the tips below)
Some tips for exploring the network in Cytoscape:
- You can select a node by clicking on it. This will display info (Name, order, clustering status) about that node in the “Node table” (E) in the bottom half of Cytoscape.
- You can select multiple nodes by pressing ctrl and drawing a box around them. The selected nodes will be highlighted in yellow in the network, and their info will be shown in the node table.
- Search for specific nodes with the field in the top right corner (F). For example, you can search for nodes in bin 1 by entering “bin_01*” (use the * wildcard!) and press enter.
- You can colour the node based on different things, such as clustering status, viral cluster number, or a taxonomic rank such as genus. What do each of these terms indicate? Refer to the Vcontact2 manual (under “VC statuses”) or paper if necessary.
To change the node colour, go to the Style panel (see figure, A) > Fill colour (B). For example you can colour the nodes for Genus by selecting “Genus” in the column field, then selecting “Discrete mapping” as mapping type, and finally generating a colour scheme by right clicking Discrete mapping > Mapping value generator and then selecting a colour scheme (C).- The ‘Always show graphic details’ button (G) can be turne on to apply the graphic style to the network at each zoom level (at a slight performance cost).
##Explore the network to answer the following questions:
- Can you find reference genomes (i.e. not from our assembly) that Vcontact classified as the same genus? What does this mean?
- Can you find the bins that clustered with crAssphages in the heatmap (lesson 4) back in the network?
- Does the vContact2 approach also How closely related to crAssphages are they?
- Do the contigs from bins (for example the putative crAssphage bins) clustered together in the network? Why (not)?
- We clustered contigs, not bins. What possible effects would expect of instead clustering bins? Which method would you prefer?
- What would you do if you wanted to more precisely wanted to determine the taxonomic relationship of the putative crAssphage-like bins?
- Can you find other bins from the assembly (look at the heatmap) that you now can assign a genus to?
- Can you find contigs that were perhaps incorrectly binned together? (how would you see this in the network)?
Key Points