Visualizing the assembly
Overview
Teaching: 0 min
Exercises: 90 minObjectives
Understand the topology of the de-Bruijn graph
Understand how the presence of similar species in the sample affects the assembly
This section is suggested as homework.
Choose one of the following two topics: “A. Paths in the de-Bruijn graph” or “B. Effect of related species”. Pick what sounds more interesting to you, and discuss your results with someone who picked the other topic. (Bandage is difficult to run on Windows.)
A. Paths in the de-Bruijn graph
We will use Bandage, a tool to visualize
the assembly graph. Bandage is difficult to run on a Windows computer. In the
releases section,
follow the instructions to download the most appropriate version, such as
Bandage_Ubuntu-x86-64_v0.9.0_AppImage.zip. To run it, unzip the file and
call Bandage from the terminal like this:
# run Bandage
$ ./Bandage_Ubuntu-x86-64_v0.9.0.AppImage
In File > Load_graph, navigate to and load the file assembly_graph.fastg of
the cross-assembly. Then click Draw graph to visualize the graph. Note that
this graph has already been compacted by collapsing nodes that form linear,
unbranching paths into unitigs. Nodes in the graph are called edge_N (confusing name…)
with N being an integer. They often correspond to the final contigs in your assembly.
Bubbles and junctions
Open the file
assembly_info.txtcorresponding to the graph you are looking at. The N in the node names as displayed by Bandage corresponds to the number assigned to continuous paths in the de-Bruijn graph by Flye. The “graph_path” column holds this information for all contigs.
- What does an asterisk * mean?
- What do multiple occurrences of the same number mean?
Pick two components of the visualized de-Bruijn graph and explain their topology and information content.
- Are there bubbles and junctions?
- Can you relate the complexity of the visualized graph to the Flye command line parameters?
B. Effect of related species
Metagenomic samples often contain several strains for a given species. This is particularly evident with viruses that typically contain many haplotypes. Each small difference between the genomes leads to a fork and a structure in the assembly graph. This complicates the path-finding algorithm implemented in the assembly tool. Mistakes at this point can lead to chimeric contigs containing sequences from more than one strain. To visualize this effect, we will align the reads in our samples back to the assembled contigs and use jbrowse2 to visualize the differences between reads and contigs. Download the tool. Under Linux or Mac, you can start the AppImage simply by typing
# run JBrowse2
$ ./jbrowse-desktop-v2.13.1-linux.AppImage
from within the corresponding folder. After starting JBrowse2, select
open sequence file(s):
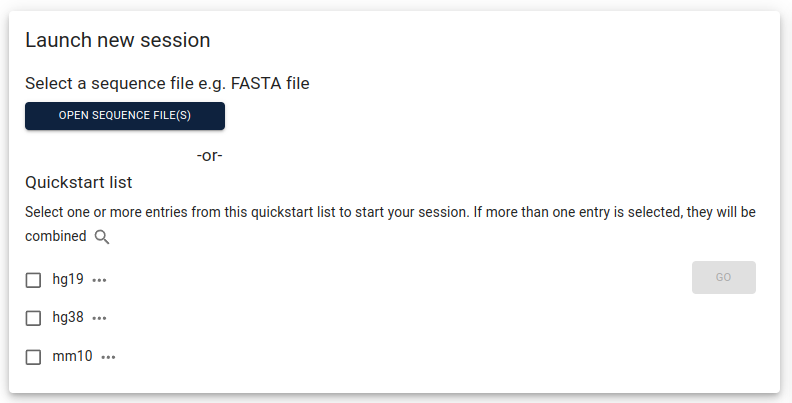
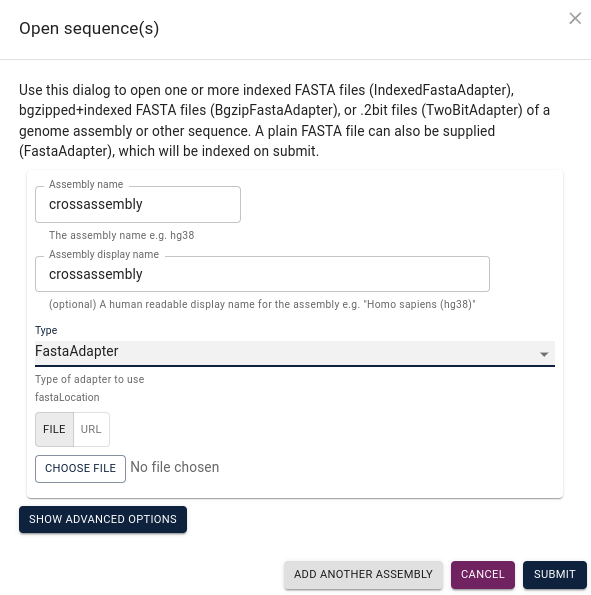
Assign a name to your assembly, select FastaAdapter under
Type and then choose file to navigate to your assembly file and submit:
Click launch view with linear genome view selected, then show all regions in assembly
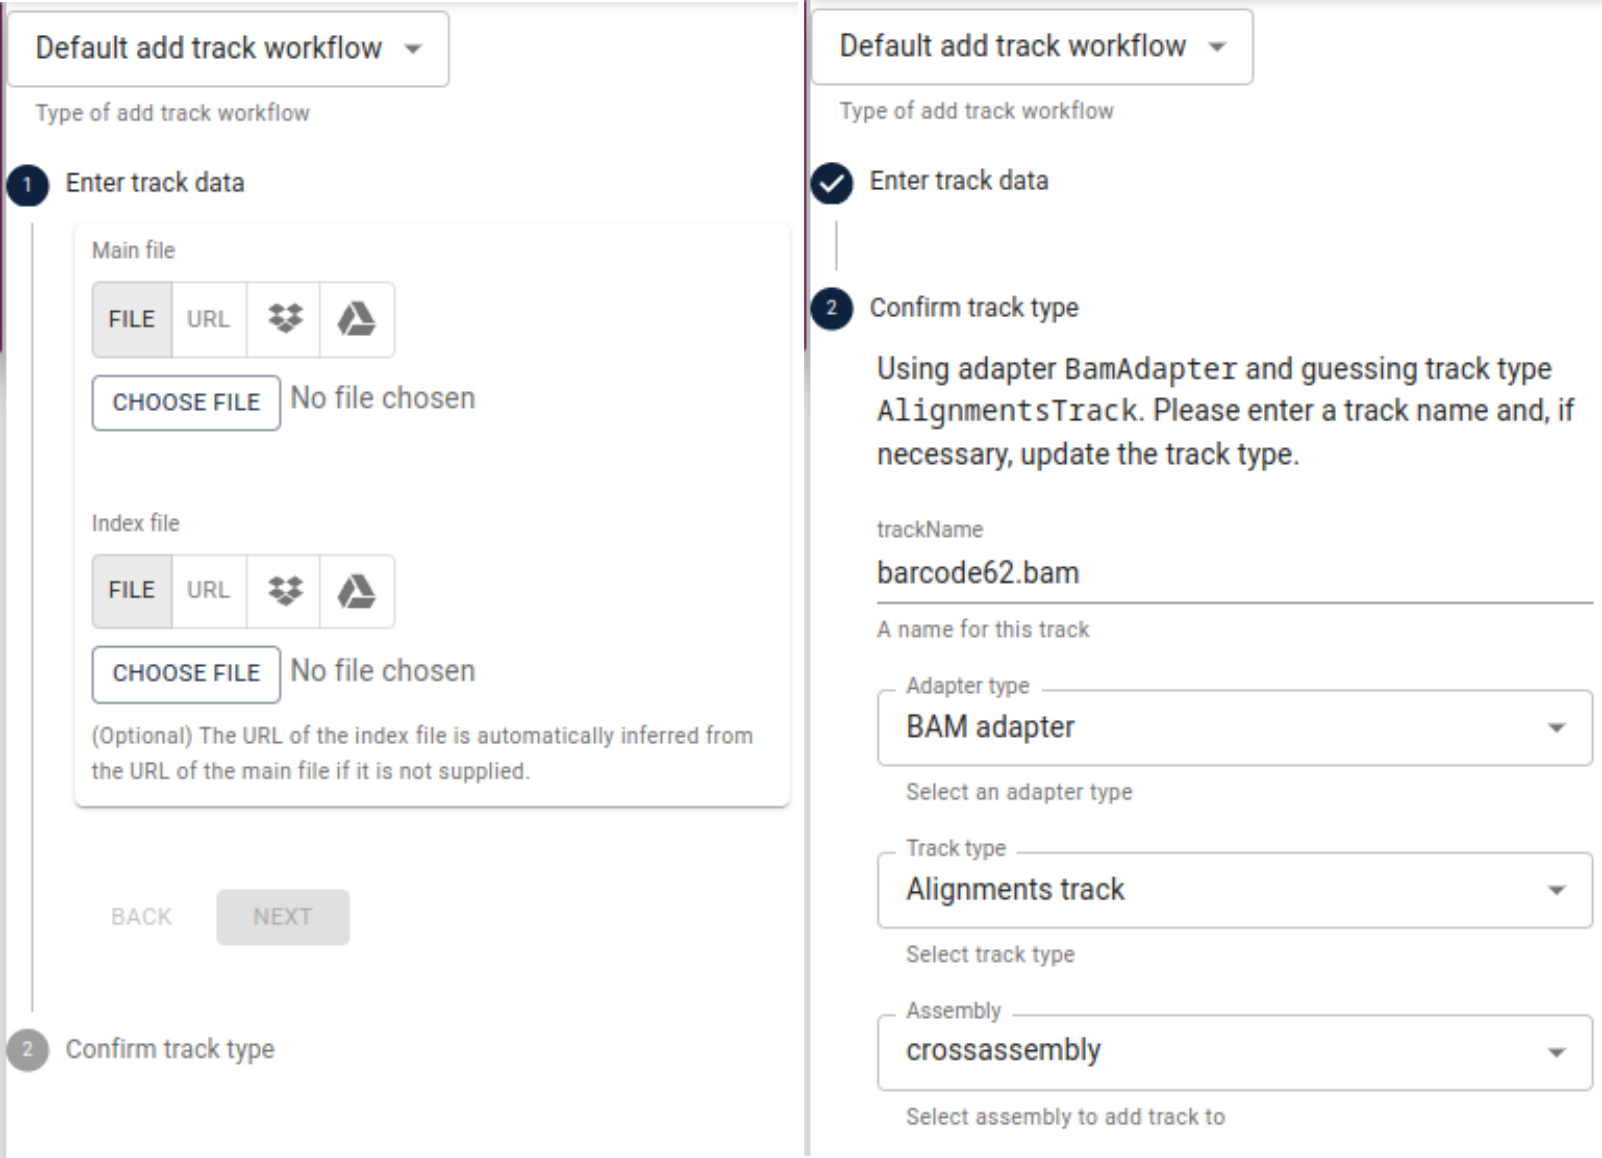
and “open track selector”, click the plus sign in the lower right corner and select
add track. Under main file, select File and then choose file and navigate to
the alignments you computed for the first of our three samples (e.g., “barcode62.bam”).
After that, repeat the same under index file and navigate to the index file of the
alignments (e.g., “barcode62.bam.csi”). Click Next and make sure, the IndexedBamAdapter
is selected and confirm.
Repeat this process for the other two alignment files and their adapter files. Now, you can inspect single reads aligned to your assembly. Try to familiarize yourself with the interface. You can search for a specific contig by typing its name into the search bar at the top of the interface.
Chimeras and reads connecting contigs
Try to look into contigs with a high coverage and find some wich have reads mapped to them in all three samples.
- Can you identify multiple virus strains visually? Make a screenshot, explain what you see, and how this fits into what you learned about assemblies with de-Bruijn graphs.
When clicking on an alignment, you can find alternative alignments of the same read to other contigs.
- Name at least one reason that (part of) a read could be aligned to multiple locations.
Key Points
Bandage can visualize the de-Bruijn graph
JBrowse2 can visualize genomic data like alignments and coverage